Market Balance Is More Than Months Of Inventory
Michelle Davis - 2024 NETAR President
Real estate professionals and the media talk a lot about balance, but to get a good handle on it, look beyond the most cited metric – months of inventory. It’s also called the absorption rate.
An improved trends perspective can be gleaned by looking at the year-to-date sales trend by price, compared to active inventory and new listings. Of course, attention has to be given to the month-over-month activity, but one month’s data isn’t a trend.
Although this year’s peak season sales are off to a bit of a slow start, they were up for the second time this year. It’s not a big increase by today’s market standards, but it would have been ranked a strong month in some of the early pre-pandemic years.
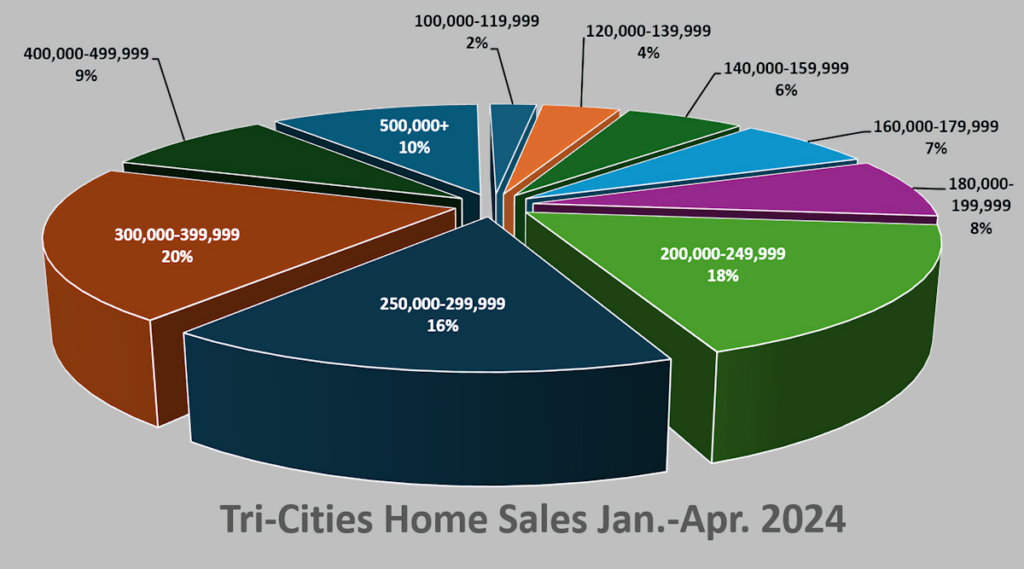
Of that 4.7% overall four-month sales increase, the affordable market ($100K-$250K) was up 0.3%. It was up three sales from this time last year.
The move-up market was up 16%, but it’s a situation where percentages don’t tell the complete story. There were 937 sales in the affordable market and 950 in the move-up market. That’s been consistent so far this year and mirrors changes in the growth patterns of those two markets.
There were 220 sales in the luxury market, up 10.6%.
The sweet spot in the affordable market has been in the $180K to $200 price range, up 29.2%.
In the move-up market, the sweet spot is in the $300K to $400 price range, up 22.3.%
The sustainability of that trend depends on the flow of new listing and pending sales, which were not available in time for this report.
So far this year new listings are up 2.5%. Of that total, the best improvement is in three price ranges: $200K-$250K, up 24.1%; $400K-$500K, up 24.7%; and $500K and up. It’s up 24.8%
Comparing the four-month sales and new listings to April’s active listings is the last step in this brief market summery survey. And since the local Multiple Listing Service is dynamic, the monthly number changes by the day, so they’re the fuzziest of the three data sets.
At mid-month, 29.8% of the listings were in the affordable price range. Most were in the $200-$250K range.
The move-up market share is 42.8% and most listings with were in the $300K-$400K range.
The luxury market active inventory is up 26.2%.
This market balance trend outlook tells us – among other things – to expect conditions that are a lot like what we’ve seen so far. The most competitive segment will continue to be the affordable market.
The top end of the luxury market looks to be as active as it was last year.
There are multiple outlier metrics that also have the potential for major changes. For instance, go to last week’s Market Pulse and check out the equity-rich position of owners with outstanding mortgages. Then remember that half the local homes are mortgage-free. That gives many owners who want to use that equity to move up and scale-down the option to make cash offers or bigger competitive offers in a multiple bidding situation.
Most have not pulled the trigger yet, but the potential is there.
NETAR is the voice for real estate in Northeast Tennessee. It is the largest trade association in the Northeast Tennessee, Southwest Virginia region, representing over 1,800+ members and 100+ business partners involved in all aspects of the residential and commercial real estate industries. Weekly market reports and information for both consumers and members are available on the NETAR website at https://netar.us